The Tape Ahead
Before you place a single spread, you check this. Binary events gap stocks straight through your strikes — earnings, the Fed, inflation prints, the jobs report. They don't care how clean your setup looks. This page is your pre-flight: what's scheduled this week, color-coded by how much it can move your trades. It updates itself — the week below is always the current one.
Why You Check This First
Your indicators read normal tape. They can't see a calendar. A bull put spread can be a textbook A+ setup and still get blown through if CPI prints hot the next morning or the company reports earnings that night. The job of this page is to tell you when the tape won't be normal — so you either shorten your expiry, size down, or simply stand aside. Most account-killing losses aren't bad setups; they're good setups placed in front of a scheduled event nobody checked for. This is the five-second habit that prevents them.
How To Read Each Part
Everything on the live page is built to answer one question: "Is anything scheduled that can move my trade more than my setup expects?" Here's how to interpret each piece.
| What you see | What it's telling you | How to act on it |
|---|---|---|
| Desk Read (the one-liner) | Risk-on / risk-off, breadth (% of the watchlist green), and the VIX in one glance. | Risk-off + high VIX = tighten up, smaller size, favor premium selling. Risk-on + calm VIX = your setups have more room to work. |
| Market Overview | Indices, the VIX, the 10-year yield, the dollar, oil and gold. The market's weather. | A spiking VIX or yield is a regime change — don't fight it with the same size you used in a calm tape. |
| Sectors | Which S&P sectors are leading and lagging today. | Trade with the rotation. A bullish name in a red sector is swimming upstream; favor names in green sectors. |
| Movers / 52-wk Extremes | The biggest moves and the names pinned at their highs or lows. | These are where exhaustion lives — exactly what the HM5 Spread System hunts. A name slammed to a 52-wk low and stabilizing is a put-spread candidate. |
| This Week's Calendar (below) | The Fed, CPI, Jobs, PPI, OPEX, and which of your names report — color-coded by impact. | Green day = clear to open. Red day = a gap risk is scheduled — don't sell a new spread that expires after it. |
| Earnings | Watchlist names reporting in the next several days. | Never hold a short premium spread through earnings. Close it, or don't open one that spans the date. |
| News Tape | The latest market headlines, newest first. | Context, not signal. If a name you're in is in the headlines, go find out why before you do anything. |
| HM5 Watchlist Heat Map | All 142 watchlist names, sorted strongest to weakest by today's move. | A glance at where momentum and pressure already are. Pair it with your chart — it never replaces the read. |
Earnings This Week
On Deck — Next Week
Clear Windows — Best Days to Open
Green = no market-wide event that day, safe to open spreads. Red = a gap risk is scheduled.
Days to Expiry + EM Multiplier
Your expiry Fridays ahead, with the √DTE multiplier for your Expected Move line: price + (EXP × multiplier). See the Expected Move tab.
This Week's Game Plan
The pre-flight before any spread. Tap to check off.
HM5 Watchlist Heat Map — Who's Moving Today
A snapshot of the whole HM5 watchlist, sorted strongest to weakest by the day's move. Green = up, red = down. It's a glance at where momentum and pressure already are — pair it with your stack before acting. (Snapshot from the latest close — a picture of the tape, not a live ticker.)
How To Read It — The Events That Move Your Spreads
Each event is a scheduled moment where price can jump more than a normal day allows. Some hit the whole market (every ticker gaps together); some hit one name. Here's what each one is and what to do with it.
| Event | What It Is | Who It Hits | The Play |
|---|---|---|---|
| FOMC | The Fed's interest-rate decision, 8× a year. The 2pm statement + press conference move everything. | Whole market | No new spreads expiring after it. Flat or shorten DTE into the print. |
| CPI | Monthly inflation report, 8:30am. The single biggest scheduled market mover most months. | Whole market | Same — don't be short premium across it unless DTE is tiny and managed. |
| JOBS | Monthly employment report (NFP), first Friday-ish, 8:30am. Big open-gap risk. | Whole market | Avoid Thursday-expiry spreads that bleed into Friday's gap. |
| PPI | Producer inflation, near CPI week. Smaller than CPI but still a market mover. | Whole market | Treat like a lighter CPI. Respect it if your spread is thin. |
| OPEX | Monthly options expiration (3rd Friday). Quad witching in Mar/Jun/Sep/Dec = extra volume + pinning. | Whole market | Expect choppy pinning into the close. Not a gap, but manage open positions. |
| EARNINGS | A single company reports. The stock can gap 5–15%+ overnight regardless of trend. | One name | Never hold a credit spread on that name through the report. Wait for the IV crush after. |
Why Red Beats Your Read
Your stack (TREND, FLOW, TIDE) is built to read normal tape — orderly buying and selling. A binary event isn't normal tape; it's a coin flip resolved in one candle. A stock in a clean downtrend can still gap up 10% on a good earnings print. That's why a red event overrides even an A+ setup: you're no longer trading the trend, you're betting on a number you don't know. The desk doesn't make that bet with defined-premium trades.

Hou5eMoney
Shares, Options & Spreads — read once, trade with precision
A simple plan that tells you exactly when to buy shares, sell premium,
buy spreads, short the tape, and when to stand aside.
The HM5 Credit Spread System
This is the simplest expression of the entire five-indicator stack. No predicting tops. No catching bottoms. You wait for a stock to exhaust itself at an extreme, confirm the move with real order flow, then sell a defined-risk spread and let time and volatility do the work. Five indicators. Five steps. Set and forget.
What You Are Actually Doing
You sell a vertical credit spread in the direction the stock has stopped moving. When a name is deeply overbought and rolling over, you sell a call spread above it. When a name is deeply oversold and turning up, you sell a put spread below it. You collect a credit up front, immediately set a good-til-cancelled buy-to-close order that targets a 25% profit, and walk away.
Put Spread — sell into a turn UP
Stock is oversold and bouncing. You sell a put spread below price. You profit if it stays above your short strike.
Call Spread — sell into a roll DOWN
Stock is overbought and rolling over. You sell a call spread above price. You profit if it stays below your short strike.
Why This Actually Works — in plain English
You don't have to take our word for it. Three forces stack in your favor the moment you place the trade — and none of them require you to guess direction correctly:
① Probability is on your side
You place your strike beyond where the stock is statistically likely to travel (that's the Expected Move — its own tab). The stock has to make a bigger-than-normal move just to threaten you. You're not betting it goes your way — you're betting it doesn't do something unusual. That's the easier bet, by a wide margin.
② Time pays you every day
An option is a melting ice cube. Every day that passes, the premium you sold loses value — and that decay flows into your pocket whether the stock goes up, down, or nowhere. You are the house collecting rent. We enter around the window where that decay is richest and the math is most in your favor.
③ You only take a small bite
We don't wait for the trade to go to zero. We grab roughly the first 25% of the credit and walk — then reset. Small, fast, repeatable. Sell a spread for $1, buy it back at 75¢, keep the 25¢. Boring on purpose. Do it again tomorrow.
Where to Run It — The Timeframe Stack
This is the part most people get backwards. You read the big picture to choose the trade, then drop to a faster chart only to time the entry. Top down. Always.
- Pick the expiry around ~24 days out (or wherever the theta — the daily decay — is richest). Far enough that time isn't rushed, close enough that decay is working hard for you.
- Enter on a 1H or 4H Confluence signal in the direction your Weekly/Daily read already chose. The higher timeframe is the boss; the lower timeframe is just when you walk in the door.
- Set your buy-to-close at 25% the moment you fill. Then walk away. The order does the work. In a choppy, headline-driven market, taking the small bite fast beats reaching for the last dollar every time.
The 5-Step Check
A name fired on a scanner. Now you decide. Walk these five steps top to bottom. Every step must pass. The moment one fails, you skip the name and move to the next — no negotiating with a setup that is already broken.
Structuring the Spread
All five steps passed. Now you build the trade on the options chain. Here is exactly what a clean put-spread entry looks like — and the four numbers that have to be right before you click Send.
📋 What This Order Means — Bull Put Spread on EBAY
🔁 How To Close — Buy To Close, Not Sell To Close
A credit spread is opened by selling (you collect money up front), so it is closed by buying it back. You are net short the spread — the closing order is always BUY TO CLOSE, never sell to close. Selling again would open a second position, not close the first.
What To Skip — No Exceptions
Most losses are not bad entries — they are trades that should never have been taken. These three conditions are instant skips. You do not read the rest of the chart. You do not "see if it works out." You move to the next name.
① ATR% above 6%
Check PULSE first. If daily ATR% > 6% the stock moves too fast to keep out of your strikes for 21–28 days. High IV that comes from a wild chart is risk, not easy premium. Skip on the first label.
② Weekly TIDE conflicts
If weekly TIDE disagrees with your signal — BUY 60%+ while you want a call spread, or SELL 60%+ while you want a put spread — you are fighting the tape. Never trade against the weekly.
③ No 21–28 DTE on the chain
Some names jump from a 16-day weekly straight to a 45-day monthly. If there is no expiry in your 21–28 day window, the trade does not exist for this system. Skip — do not force a bad expiry.
Leveraged & inverse ETFs
SOXS, SQQQ, TQQQ, UVXY, SPXU and the like decay by design and carry 100%+ ATR. They also break the GRID scale on charts. Keep an EXCLUDE watchlist on the scanner so they never appear.
Premium too thin
If the best 80–85% Prob OTM strike pays less than $0.50 per $1 of width, the trade is not worth the risk. Do not move strikes closer to the money to manufacture credit. Skip.
The Spread Trader's Day
This is a set-and-forget income strategy, not a screen-staring one. The entire active workload is a focused window in the morning. After your orders are in with their GTC exits attached, the correct action for the rest of the day is to leave them alone. (Trading shares, the wheel, or active options too? The full hour-by-hour session schedule lives in Schedule & Rules.)
- Run your spread-system scans to build the candidate list — Weekly and Daily, both directions.
- Write down every name. Star any name that appears on both Week and Day — those are your A+ candidates.
- On each candidate, check Step 1 — weekly TIDE. BUY 60%+ = puts only. SELL 60%+ = calls only. Neither = drop the name.
- Let the open settle — do not chase the first 15 minutes of noise.
- On the names that survived the weekly filter, run Steps 2–5: TRIGGER confluence, FLOW + TIDE daily, PULSE (ATR%, IVR, IV), then the chain.
- Any step fails → skip and move on. No exceptions.
- SELL TO OPEN the spread at the mid. The instant it fills, set a GTC BUY TO CLOSE at 75% of the credit (sold for $1.00 → close at $0.75) to bank 25% profit.
- That is the trade. Theta and IV crush do the rest over the coming days.
- Your exits are already working as GTC orders. Let them fill on their own.
- No re-checking, no second-guessing, no adding risk into a quiet tape.
Welcome to the Trading Journey
Before you read another word, hear this: this is not financial advice. This playbook teaches you to read the Hou5eMoney Tradedesk across everything you might trade — long shares, short shares, intraday scalps, swing positions, and the full options stack from CSPs to vertical spreads. Five indicators speak the same color language. Their dashboards line up to tell you, in plain terms, what the market is doing right now and what kind of trade — shares or options — that environment calls for. What you do with that read is your decision and your risk.
The Tradedesk is not magic. It is a system. Whether you are buying 100 shares of a name on a BUY DIP arrow, shorting a breakdown candle, selling a cash-secured put, or buying a defined-risk debit spread — the read is the same. Direction comes from Trigger and Grid. Strength comes from Pulse. Confirmation comes from Flow. Sizing comes from Tide. Your job is to match the right vehicle to the read the colors are giving you, size positions you can afford to lose, and exit the moment the read flips.
Who We Are & What We Do
Hou5emoney trades the way the big institutions trade — and we built this whole desk to teach you the same approach in plain English. Here's the honest truth Wall Street dresses up in jargon: nobody can reliably call the exact top or the exact bottom of a move. Anyone who tells you they can is selling you a lottery ticket. The market — especially right now, whipping around on headlines and geopolitical noise — is too choppy for that. So we stopped trying.
Instead, we skim. We take small, high-probability bites out of the market over and over — the way a casino doesn't need to win every hand, just a tiny edge played a thousand times. You eat an elephant one bite at a time. That's the whole mindset of this desk. We're not chasing 1,000% overnight gambles; we teach real market data — where the smart money is actually positioned, when a move is exhausted, and how to get paid to wait. That's a skill that pays you for the rest of your life, not a coin flip.
🌱 If You're Brand New
You don't need a finance degree or a big account. You need a process you can repeat. We give you one — colors on a screen that tell you what to do, plus the patience to take small wins. We'll define every word as we go. You're in the right place.
⚡ If You're Already Experienced
You already know direction-guessing is a losing game. What you may not have is a mechanical, defined-risk routine you can run every morning in under ten minutes. That's exactly what this is. This is your level-up.
How to Use This Playbook
This playbook covers everything from the ground up. The tabs are ordered to build on each other — top to bottom — and every page ends with a Next up → button that walks you to the next one. You don't have to memorize anything; just follow the path. Both roads below lead to the same place: the HM5 Spread System, the one repeatable trade you'll run over and over.
🌱 Brand New to Trading
Start at the top and follow every Next up → button in order. Don't skip — each tab assumes the one before it. Take your time on 5 Indicators (the language) and Options Basics (the vocabulary). By the time you reach the HM5 Spread System, it will all click.
⚡ Already Trade
Skim 5 Indicators for the color language, then jump to the HM5 Spread System, The Tape Ahead, and Scanners & Setups. The rest — Shares, the Wheel, Credit/Debit mechanics — is reference you pull when a setup calls for it.
Your Roadmap
The whole journey, in order. Tap any step to jump straight there.
Your Toolkit
The playbook is one of several tools Hou5eMoney gives the community. Use all three together:
📘 The Playbook
This guide — the full system, start to finish. Read it once, reference it forever.
🖥️ The Demo
An interactive clone of the live dashboards, so you can see every pill and signal in action before you load a thing.
📊 The Activity Tracker
A trade journal that logs every position you take, so you can see what's working and prove the system to yourself.
How to Use the Activity Tracker
- Open the Tracker from the top menu (the button is on every page).
- Log every trade as you take it — ticker, the signal that fired, the IVR, the structure you used, and your planned exit.
- When you close it, record the result. Win or loss — log it honestly.
- Each week, review: which signals win for you, which ones you fumbled, where you broke a rule. That review is how a beginner turns into a consistent trader.
Your tracker data stays on your own device. Pair it with your 30 days of paper trading and you'll finish with hard proof of whether you're ready for real money — instead of a guess.
Paper-Trade First
Run the Tradedesk in a paper account for at least 30 days before a single real dollar of premium touches it. Log every spread, every wheel assignment, every win, every loss, every broken rule.
Mechanical, Not Magical
Every signal is drawn by a script — not a hunch. If the colors disagree, you stand aside. Cash is a position. No trade is also a trade.
Every Contract Has an Exit
If the trend flips or the Exit Dot fires, you close or roll. No exceptions. Define your max loss before you enter. Options can go to zero. Plan for it.
The Hou5eMoney Creed
Read it once. Then read it before every session.
« Trade the plan. Let the colors guide you. Your only job is to obey them. »
Let's Go to Work
If you took a job, you'd learn how to do it. The Tradedesk is no different — you'll get out of this system exactly what you put into it. Show up, run the routine, follow the rules. Hou5eMoney does not predict the future. It does one thing well: it shows you, in plain colors, what the market is actually doing right now so you can stop guessing and start reacting — then pick the right options structure to express that read.
The Whole System in Three Sentences
- Look at the TREND labels. If they say BULL on all five indicators, you sell puts, buy call spreads, or run the wheel long-side. If they say BEAR, you sell calls or buy put spreads. If anything says CHOP, you do nothing.
- Check IVR on the Pulse dashboard. IVR above 50% = sell premium (credit spreads, CSPs, covered calls). IVR below 30% = buy premium (debit spreads, defined-risk directional plays). The number tells you the structure. The color tells you the direction.
- Exit when the signal reverses. When the purple Exit Dot appears, the trend flips, or the CVD trend rolls against your position — close for a credit, roll to a later expiry, or cut the loss. Never let a defined-risk spread become an undefined-risk position by removing a leg.
That's the entire job.
The Multi-Timeframe System
Every timeframe has a different job. Stack them together and you stop guessing — you read it.
| Timeframe | Job | Questions to Ask | Primary Tools |
|---|---|---|---|
| WEEKLY | Market Direction | Where is macro money flowing? IVR elevated? Theta environment? | HM WEEKLY CREDIT · TIDE |
| DAILY | Trend Bias | Is the trend healthy? Can I sell premium against structure? | HM DAILY TREND · GRID |
| 4H | Setup Engine | Is momentum accelerating? Is FLOW confirming the spread direction? | HM 4H HIGH BETA · FLOW · PULSE |
| 1H | Timing + Expansion | Is a squeeze firing? Is volatility expanding for entry? | HM SQUEEZE EXPANSION 1H · PULSE |
| Daily/Weekly | Structure Selection | IVR? EXP move? How wide do I go? Which expiry? | PULSE (IVR · EXP · ATR%) |
Paper Trade First. No Exceptions.
⚠️ READ THIS BEFORE YOU TOUCH REAL MONEY ⚠️
Options trading has two separate skill sets you must master independently. First: reading the Tradedesk correctly. Second: executing the actual trade inside ThinkorSwim without making mechanical errors. Most beginners lose money not because their read was wrong — but because they entered the wrong strike, wrong expiry, wrong quantity, or wrong order type. Paper trading eliminates both failure modes at zero cost. Do it for 30 days minimum. Then 30 more.
What Can Go Wrong in Execution
- Selling the wrong leg first (orphaned naked short)
- Wrong expiry — selling a 2 DTE when you meant 21 DTE
- Wrong quantity — 10 contracts instead of 1
- Buying when you meant to sell (or vice versa)
- Market order instead of limit order
- Forgetting the protective long leg entirely
What Happens When You Do
- Naked short = unlimited loss potential
- 2 DTE spread expires worthless in 48 hours
- 10 contracts = 10× the capital at risk
- Wrong direction = immediate max loss
- Market order = terrible fill, wide slippage
- One-legged spread = uncapped assignment risk
How to Enable Paper Trading in ThinkorSwim
The Five Indicators at a Glance
Five scripts. One color language. One trend brain. When their dashboards agree you have a confirmed setup — when they disagree, sit on your hands and let your existing spreads collect theta.
Upper · Price
TRIGGER
Paints candles, draws EMA stack, fires entry arrows, drops Exit Dots. The options entry signal.
Lower · Strength
PULSE
–100 to +100 strength meter. IVR / IV / EXP / ATR% pills. Decides your spread structure.
Lower · Order Flow
FLOW
Per-bar CVD. Confirms real buying vs. fake moves. Protects you from entering a spread into a trap.
Upper · Structure
GRID
Three nested channels. Dashboard shows BUY / HOLDING BULL / EXIT / WAIT. HOLDING BULL = stay in the spread. WAIT = no new entries.
Lower · Volume
TIDE
Weekly institutional volume vs. 30-week average. TREND BULL SURGE / a yellow VOL pill (≥200%) = size up. Thin gray VOL = go small.
The Color Language
Every signal is encoded by color. All five indicators share the same palette. Learn the color once — read it everywhere.
How to Use Each Indicator
Each indicator answers one question. You read them in order — direction first, then confirmation, then size. Here is the job of each one and exactly what its signal looks like on the chart.
| Indicator | The Question It Answers | What the Signal Looks Like |
|---|---|---|
| TRIGGER Upper · on price |
"Do I take the trade — and which way?" | Colored candles + three EMAs (cyan fast, yellow mid, gray slow). Arrows fire entries: yellow BREAKOUT, lime BUY DIP, gold RECLAIM BUY, cyan CONFLUENCE BUY, cyan TRAP LONG (up); orange BREAKDOWN, pink SELL RIP, purple RECLAIM SELL, orange CONFLUENCE SELL, red TRAP SHORT (down). Dots: purple EXIT-LONG above a candle, green EXIT-SHORT below. It also now prints the FLOW divergence dots — cyan below the candle (bull), red above (bear). |
| FLOW Lower · order flow |
"Is the move real, or a trap?" | Per-bar delta histogram + CVD trend. Green/mint bars = buyers winning; magenta/lavender = sellers. Yellow/orange bars = acceleration. Divergence dots: cyan dot at the pane bottom = bull divergence (price made a lower low, CVD didn't); red dot at the pane top = bear divergence. Bright = confirmed by this bar's delta; faint = forming, not confirmed yet. These dots sit at the same bar as the ones now on the TRIGGER price chart above, and they lead the entry — a bull dot prints 1-2 bars before the BUY arrow, a bear dot before the SELL. |
| PULSE Lower · strength |
"How strong is this move?" | One histogram bar, –100 to +100, colored by regime: bright green strong bull, mint soft bull, magenta strong bear, lavender soft bear, gray chop. Pills show IVR / IV / EXP / ATR% for structure and a SQZ (squeeze) state. Above +50 or below –50 is real conviction. |
| GRID Upper · structure |
"Is the trend healthy enough to trade?" | Three nested dashed channels wrapping price (long / mid / short). The dashboard gate reads one word: BUY HOLDING BULL EXIT WAIT. HOLDING BULL = stay in. WAIT = no new entries. |
| TIDE Lower · volume |
"Is big money actually here this week?" | Split volume bars (green buying / magenta selling) vs. the prior-period average. Dashboard reads TREND BULL/BEAR (with SURGE when volume is unusual), plus a VOL% pill: yellow ≥200% (unusual — max size), green ≥100% (above average — full size), gray <100% (thin — size down). It is your sizing dial, not an entry trigger. |
The 3-of-5 Rule — Before You Take Any Trade
No single indicator is a trade. The desk is built so the five confirm each other. Require at least three of the five to agree before you commit. More agreement = bigger size. Fewer than three = stand aside and let theta work on what you already hold.
The Full Stack in Action
Before we break down each indicator individually, here is the entire Hou5eMoney Tradedesk running live on a single ticker. Every panel below the price chart is one of the five indicators. When they all light up the same color, the trade picks itself.
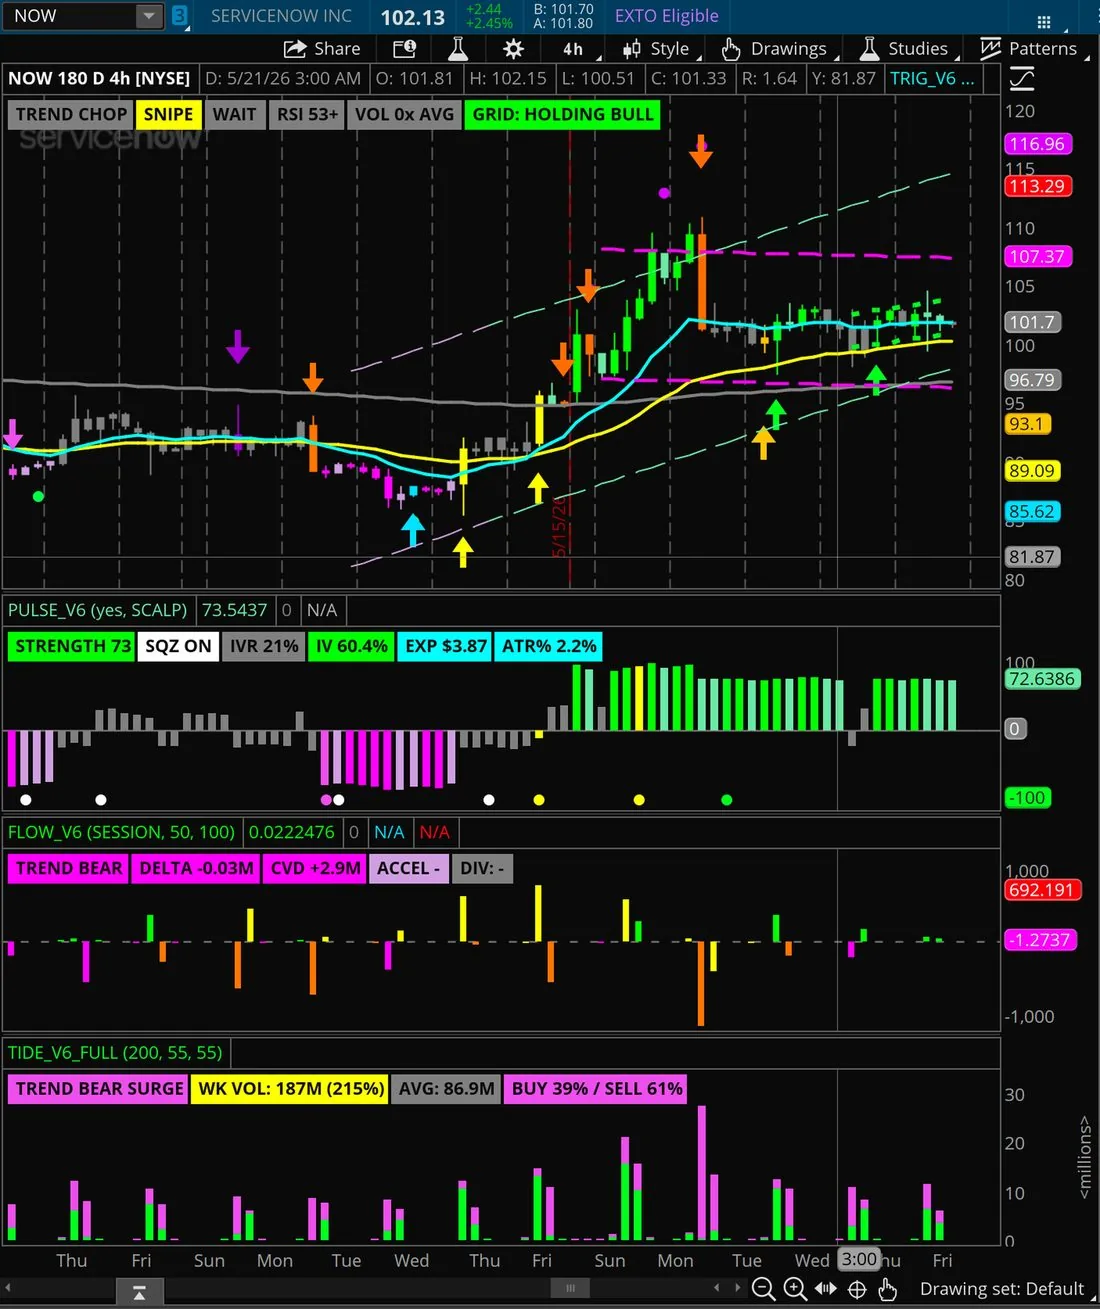
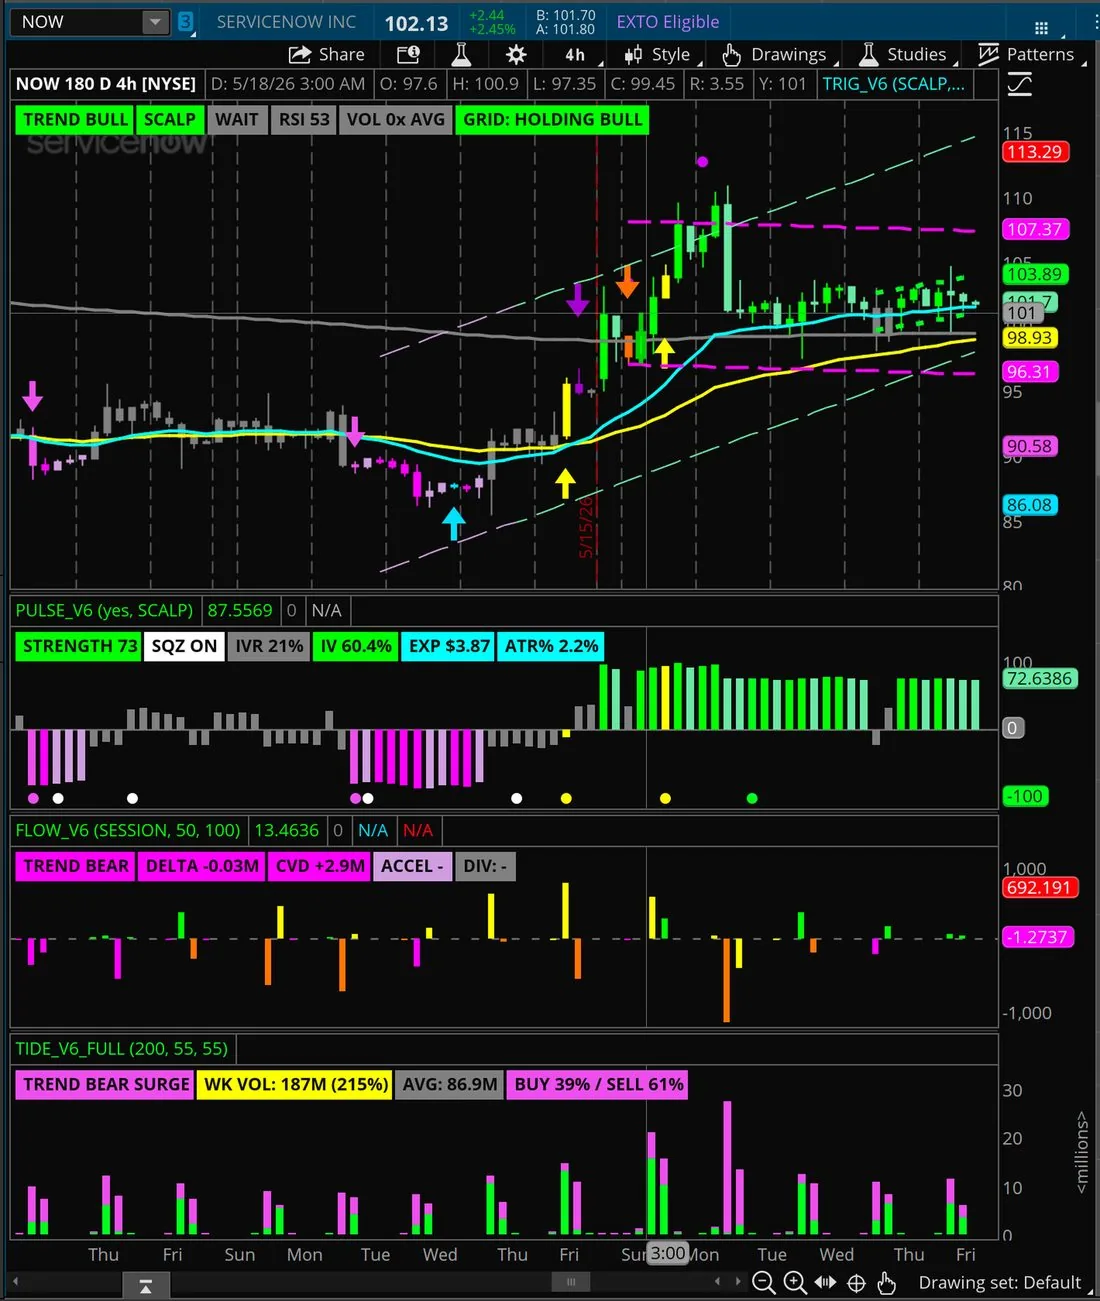
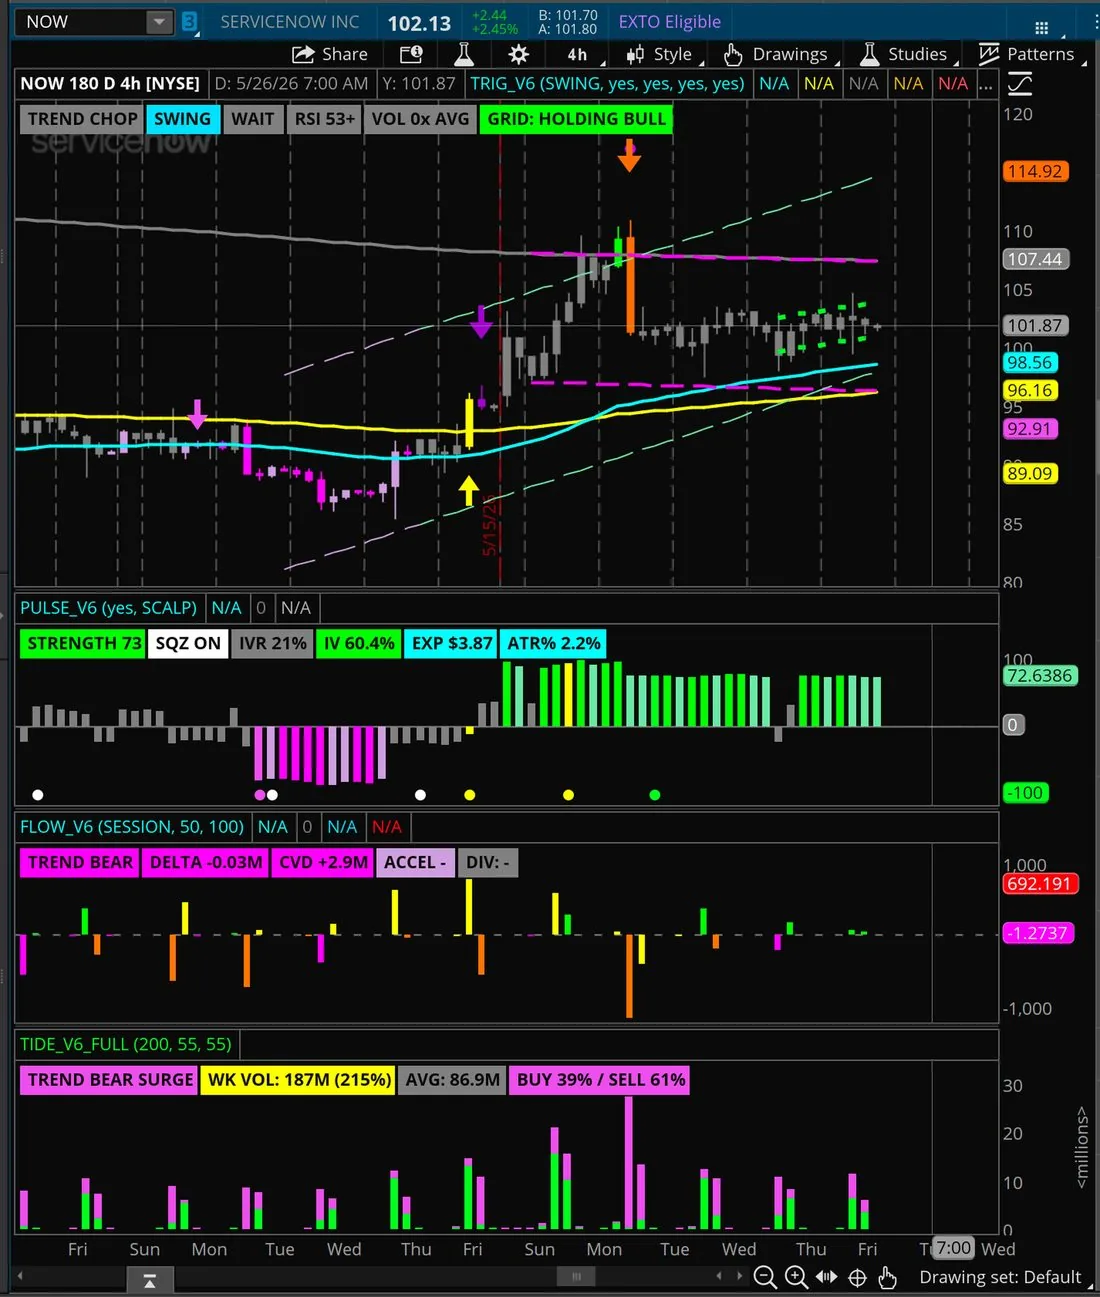
The same NOW 4h chart under all three TRIGGER speed settings. Notice how the dashboard, entry arrows, and trend state shift: SNIPE fires the most signals (fast EMAs, 3-bar cooldown), SWING the fewest (slow EMAs, 12-bar cooldown), SCALP sits between. Set PULSE to the same speed as TRIGGER so their trend states agree.
Top Panel — Trigger
Price action with EMA stack, color-coded candles, and entry arrows. This is your when.
Middle Panels — Pulse & Flow
Strength meter, IVR, signal dots, delta, and CVD. This is your how hard and who is winning.
Bottom Panel — Tide
Weekly volume regime — your position sizing dial. Heavy week = full size. Thin week = half.
Trigger — Your Entry Clock
Trigger is the only indicator that says "take the trade." For options traders, Trigger replaces the need to guess entry timing. When an arrow fires, that is your reference bar — your strike selection anchor, your delta decision, your debit or credit entry point. Never enter a spread without an arrow or an Exit Dot signal. A colored candle alone is noise.
How Trigger Arrows Map to Options Entries
| Trigger Signal | Options Entry (IVR > 50%) | Options Entry (IVR < 50%) |
|---|---|---|
| BREAKOUT Yellow ↑ | Sell bull put spread — strike below breakout candle low | Buy bull call spread — long strike at or near breakout close |
| BUY DIP Lime ↑ | Sell CSP or bull put spread — strike below dip low | Buy bull call spread — catches the bounce with defined risk |
| CONFLUENCE BUY Cyan ↑ | Sell bull put spread — size up. Highest IVR environment favored. | Buy bull call spread — size up. Strongest signal. Do not pass. |
| RECLAIM BUY Gold ↑ | Sell CSP below the reclaim candle low | Buy bull call spread — fast move expected post-reclaim |
| BREAKDOWN Orange ↓ | Sell bear call spread — strike above breakdown candle high | Buy bear put spread — long strike at or near breakdown close |
| SELL RIP Pink ↓ | Sell bear call spread — strike above rip high | Buy bear put spread — catches the fade with defined risk |
| CONFLUENCE SELL Orange ↓ | Sell bear call spread — size up | Buy bear put spread — size up |
FLOW Divergence Dots — Now Right on Your Candles
Trigger now prints the FLOW divergence dots directly on the price chart, so you see the early-warning signal without dropping your eyes to the lower pane. Cyan dot below a candle = bull divergence (price made a lower low, CVD did not — the dip is finishing, look for longs). Red dot above a candle = bear divergence (price made a higher high, CVD did not — fade the rip). Each chart dot sits at the exact same bar as its twin in the FLOW pane below it, so they line up vertically — the dot on price and the dot in FLOW are the same signal.
Bright vs. faint: a bright, solid dot means the bar's own order-flow delta confirms the divergence — higher conviction. A faint, dim dot means the divergence is forming but the bar hasn't confirmed yet — watch it, don't act on it alone. A divergence dot is a heads-up, not an entry. Wait for a Trigger arrow or an Exit Dot on the same zone before you commit.
TRIGGER on the Dashboard — every pill, plain English
When the indicators load, your screen fills with little colored tags called pills — each one is a single fact about the market right now. Color is the shortcut: green = go / strong, yellow = caution / decision, red & magenta = stop / down, cyan = a number to read, gray = nothing happening. Each indicator’s pills are decoded right in its own section — here are TRIGGER’s.
| Pill | In plain English |
|---|---|
| TREND | Which way the market is leaning: BULL (up), BEAR (down), or CHOP (no clear direction — sit out). This is the first thing you read, every time. |
| SCALP | Your speed setting — how twitchy the signals are. SNIPE = fast/short trades, SCALP = balanced, SWING = slow/longer holds. Just tells you which mode the chart is in. |
| CONFLUENCE / BUY DIP / BREAKOUT… | The current signal — what the chart wants you to do right now (or WAIT if nothing). The arrows on the chart are the same signals. |
| RSI | A 0–100 "how stretched is it" meter. Over 70 = ran up hot (may pull back), under 30 = sold off hard (may bounce). The + means an extra-strong trend. |
| VOL | How busy this bar is vs. normal. 1.0x = average, 2x = double the usual crowd, 0.4x = quiet. More volume behind a move = more real. |
Flow — The Clarity Engine
Flow estimates order flow — who appears to be winning the volume battle inside each candle. It uses price position within each bar's range as a proxy for buying and selling pressure, then tracks it cumulatively as CVD. This is a directional pressure gauge, not an exact audit — treat it as a confidence tool, not a certainty. For options traders, Flow is your directional reality check. It prevents you from entering a credit spread into a trap reversal or a debit spread into exhausted momentum. Before every spread entry, confirm Flow agrees with your direction.
FLOW in Plain English — the War and the Punch
Three numbers on the FLOW dashboard trip up new traders. Here they are in dead-simple terms — think of every candle as one round of a fight between buyers and sellers:
One line to remember: CVD tells you who's winning the war. ACCEL tells you who won the last punch. They can disagree — and that's the whole point: the punch turns before the war does.
For Credit Spread Entries
Bull put spread: TREND BULL + CVD rising. Selling puts into genuine accumulation.
Bear call spread: TREND BEAR + CVD falling. Selling calls into genuine distribution.
If TREND is FLAT or opposite to your spread direction — wait. You're selling premium into uncertain flow. That's a coinflip, not an edge.
For Debit Spread Entries
Bull call spread: ACCEL UP bars (yellow) confirm buyers pressing. TREND BULL + rising CVD = the move has legs.
Bear put spread: ACCEL DN bars (orange) + TREND BEAR + falling CVD.
Divergence dots are your best friend. Cyan dot at the bottom = bull divergence = buy call spread dip. Red dot at the top = bear divergence = buy put spread fade. These same dots now print directly on the TRIGGER price chart too — a cyan dot below the candle for a bull divergence, a red dot above the candle for a bear divergence — sitting at the exact same bar as the FLOW pane dot below it, so you can read the warning right on price without looking down. A bright dot means the bar's own delta confirms it; a faint dot means the divergence is forming but not yet confirmed.
FLOW on the Dashboard — every pill, plain English
| Pill | In plain English |
|---|---|
| TREND | Who's ahead in the whole fight — BULL (buyers), BEAR (sellers), FLAT (tied). |
| DELTA | Who won this one bar and by how much. + = buyers, − = sellers. |
| CVD | The running score of every bar added up = the trend. Falling = sellers ahead overall. |
| ACCEL | Is the latest push harder or softer than the last? ACCEL UP ≠ price up — it means selling is easing. An early heads-up the trend may turn. |
| DIV | "Divergence" — price and the buyers/sellers disagree (a reversal warning). − means none right now. |
Grid — The Structure Backbone
Grid draws three nested channels that wrap price action. For options traders, Grid answers the question: "Is the trend healthy enough to sell premium against, or is it breaking down?" The GRID action gate on the Trigger dashboard tells you in one word.
| Grid State | Options Action |
|---|---|
| GRID: BUY | New bull put spread or CSP entry. EMAs just stacked bull. Momentum confirmed. Full size. |
| HOLDING BULL | Hold existing bull spreads and CSPs. Theta working. Trail covered calls with fast EMA. |
| GRID: EXIT | Close or roll all bull spreads. Fast EMA crossed below mid EMA. Trend breaking. Do not argue with it. |
| GRID: WAIT | No new spreads in either direction. Stand aside. Cash is a position. Theta kills buyers; assignment risk kills sellers in unclear trends. |
GRID on the Dashboard — every pill, plain English
| Pill | In plain English |
|---|---|
| BUY | A fresh healthy up-trend just started. Green light for new longs. |
| HOLDING BULL | The up-trend is still good — stay in what you've got. |
| EXIT | Momentum rolled over. Time to close or tighten up. |
| WAIT | No clean trend. Don't open anything new. |
Pulse — Your Structure Selector
Trigger says when. Pulse says how hard and what structure. The six Pulse pills are your options trade blueprint. Read them before you pick a single strike.
| Pill | What It Shows | Options Implication |
|---|---|---|
| STRENGTH 78 | Composite momentum –100 to +100 | >+50 = debit spread has directional backing. <±20 = chop, no spreads. Below –50 = bear structure only. |
| SQZ ON / FIRED | Squeeze state. ON = coiling. FIRED = breaking. | SQZ FIRED in bull regime = buy debit call spread NOW before IV expands. SQZ ON = wait for direction. |
| IVR 47% | IV Rank — current IV vs. 52-week range | The structure decision pill. >50% = sell premium. <30% = buy premium. 30–50% = context-dependent. |
| IV 28.4% | Current implied volatility, annualized | Rising IV (green) = premium expanding. Sell before it peaks. Falling IV (gray) = sell opportunity diminishing. |
| EXP $5.59 | Options-implied expected dollar move | Your minimum distance for strike selection. Short strikes go outside EXP. Spread width should exceed EXP. |
| ATR% 1.5% | Recent average bar range as % of price | Higher ATR% = wider stops needed = wider spread widths = more premium. Use this to size spread width. |
PULSE on the Dashboard — every pill, plain English
| Pill | In plain English |
|---|---|
| STRENGTH | One number, −100 to +100, for how powerful the move is. Past +50 = strong up, past −50 = strong down, near zero = weak/chop. |
| SQZ | "Squeeze." ON = price is coiling tight like a spring (a big move is loading). FIRED = the spring just released — move starting. OFF = nothing coiled. |
| IVR | The most important options pill. "Is option premium expensive or cheap right now?" (0–100%). Over 50% = expensive → SELL premium (credit spreads). Under 30% = cheap → BUY premium (debit spreads). |
| IV | Implied Volatility — how much movement the market is pricing in. Higher = options cost more. IVR (above) turns this into an easy "cheap or expensive" read. |
| EXP | The Expected Move in dollars — how far this stock can realistically travel in one day. You place your option strikes outside this number. (Full tab on this later.) |
| ATR% | Average daily swing as a % of price — basically "how jumpy is this stock." Bigger = wider moves = give your trade more room. |
Tide — The Size Multiplier
Tide answers: "Is institutional money actually showing up this week, or is this a thin tape I should size down on?" For options traders, Tide is your position sizing dial. A great Trigger signal in a thin-volume week is a half-size trade. The same signal in a TREND BULL SURGE week (unusual volume, buyers leading) is a full-size trade or more.
| Tide Reading | Spread Sizing Rule |
|---|---|
| TREND BULL SURGE + yellow VOL pill (≥200%) | Maximum size. Full premium. Unusual institutional volume with buyers leading — the spread has the wind at its back. |
| TREND BULL + green VOL pill (≥100%) | Full size. Above-average participation with buyers leading confirms the trend signal. |
| TREND BULL + gray VOL pill (<100%) | Standard-to-half size. Buyers lead but on thin participation — whippy candles, the spread can get tested. Size down. |
| TREND BEAR + gray/green VOL pill | No new bull spreads. Sellers are leading — bias is down. Manage or close existing longs. |
| TREND BEAR SURGE + yellow VOL pill (≥200%) | Bear structure only. Unusual volume with sellers leading. Any bull spread you have on should be evaluated for early closure or roll. |
TIDE on the Dashboard — every pill, plain English
| Pill | In plain English |
|---|---|
| TREND | Are buyers or sellers controlling the volume this period. SURGE = unusually heavy. |
| VOL % | This period's volume vs. normal. ≥200% (yellow) = unusual, big players in → max size. ≥100% (green) = above average → full size. <100% (gray) = thin → size down. A P = partial (week not finished). |
| AVG | The normal volume it's comparing against. Just the yardstick for the VOL % above. |
| BUY / SELL % | The split inside the bars — what share was buying vs. selling. 65% sell = sellers did most of the work. |
Options: The Language
You don't need to be an options mathematician. You need to know what each structure does, when the Tradedesk calls for it, and how to enter and exit cleanly. Here is everything you need — nothing more.
The Four Building Blocks
Call Option
The right to buy 100 shares at the strike price before expiry. Gains when price rises above the strike. Costs a premium — paid upfront, at risk if price stays flat or falls. Tradedesk signal: BREAKOUT, BUY DIP, CONFLUENCE BUY in bull trend.
Put Option
The right to sell 100 shares at the strike price before expiry. Gains when price falls below the strike. Costs a premium — paid upfront, at risk if price stays flat or rises. Tradedesk signal: BREAKDOWN, SELL RIP, CONFLUENCE SELL in bear trend.
Selling a Call (Short Call)
You collect premium and take on the obligation to sell shares if assigned. Profits from flat-to-down price action or from IV crush. Used in covered calls and credit spreads. Best when: trend is neutral-to-bear, IVR > 50%.
Selling a Put (Short Put)
You collect premium and take on the obligation to buy shares if assigned. Profits from flat-to-up price action. Core of the Wheel strategy. Best when: trend is bull, IVR > 50%, Tide showing heavy flow.
Naked Positions vs. Spreads — Know the Difference
The word "naked" gets used two ways in options. Both matter. Both can hurt you if you mix them up.
Naked Long — Buying a Call or Put Outright
You buy a call or a put with no other leg attached. One single contract. You pay the full premium upfront. Your max loss is what you paid — nothing more. Max gain is uncapped on a long call (price can rise forever) or large on a long put (price can fall to zero). This is what most retail traders mean when they say "naked call" or "naked put" — but the cleaner term is long call or long put. Example: Buy 1 SPY $480 call for $3.50. You paid $350. If SPY rips, you can make hundreds. If SPY does nothing, you lose the $350 — full stop, no margin call, no assignment risk.
Naked Short — Selling a Call or Put Without a Hedge
You sell a call or put with no protective long leg. You collect premium upfront — but your downside is undefined. A naked short call has theoretically unlimited loss (stock can rise to infinity). A naked short put can lose huge amounts if the stock craters to zero — and you'll be assigned 100 shares at the strike either way. This is the dangerous "naked" — and the one this playbook is built to prevent. CSPs (cash-secured puts) are technically naked shorts but covered by cash. Credit spreads are NOT naked — the long leg is your hard stop.
When to Use a Naked Long vs. a Debit Spread
Both make money on the same directional read. Different trade-offs.
| Use a Naked Long (Long Call / Long Put) When... | Use a Debit Spread When... |
|---|---|
| You expect a large, fast move — earnings, breakout off a squeeze, CONFLUENCE BUY/SELL with Tide unusual | You expect a moderate move within a defined range |
| IVR is very low (under 25%) — premium is cheap, no point capping upside with a short leg | IVR is moderate (25–50%) — short leg helps offset the IV cost |
| You want uncapped upside — willing to pay more for the home run potential | You want defined max gain and defined max loss — sleep-at-night math |
| Account is small and you only have a few hundred to risk | You can afford the slightly higher net debit of a multi-leg structure |
The Three Greeks You Actually Use
| Greek | What It Measures | How the Tradedesk Handles It |
|---|---|---|
| Delta | How much the option moves per $1 move in the stock | Trigger arrows + trend direction = delta selection. In-trend = higher delta. Counter-trend = lower delta or no trade. |
| Theta | Daily premium decay — time working for the seller, against the buyer | GRID: HOLDING BULL = theta working in your favor on CSPs/covered calls. GRID: WAIT = theta risk for buyers. |
| Vega | How much the option moves per 1% change in IV | IVR pill on Pulse. IVR > 50% = sell vega (credit). IVR < 30% = buy vega (debit). Never ignore this pill. |
Advanced Structures — Know These, But Don't Chase Them
These structures exist. You will hear about them. Here is what they are and why the Tradedesk does not prioritize them for most traders.
| Structure | What It Is | When Traders Use It | Why We Deprioritize |
|---|---|---|---|
| Iron Condor | Sell OTM call spread + sell OTM put spread simultaneously. Profits from low volatility. | When IVR is very high and you expect price to stay in a tight range. | Requires precise range prediction. Tradedesk is a trending system — condors fight trending markets. |
| Straddle / Strangle | Buy (or sell) a call AND a put on the same stock. Profits from a large move in either direction. | Around earnings or major events when a big move is expected. | Extremely expensive to buy; dangerous to sell without defined risk. Not a Tradedesk structure. |
| Calendar Spread | Sell a near-term option, buy a longer-dated option at the same strike. Profits from theta decay. | When IV is low short-term but you expect a rise. | Requires precise IV timing. Complex to manage. Master spreads first. |
| Butterfly | Three strike, limited-risk structure that profits from pinning at a specific price. | High precision setups near known support/resistance. | Narrow profit zone. Hard to time. Not mechanical with the Tradedesk signals. |
Close Early. Don't Wait for Expiry.
This is the single most important habit separating profitable options traders from blown-up accounts. Whether you are running credit spreads, debit spreads, CSPs, covered calls, or a naked long call you bought on a breakout — you do not hold to expiry. You close at a planned profit target. Read the rest of this page twice. Tape it to your monitor.
Why You Close Early — The Math
It feels good to "win the whole credit" or "let the spread expire worthless." It is also the single fastest way to give back a winning trade. Here's why.
Theta Decay Is Not Linear
The first 50% of theta decay on a 45 DTE spread typically arrives in the first 14–21 days. The last 50% takes the remaining 24–31 days. You are paid most of your premium long before expiry — and risk all of it for the diminishing remainder. Close the trade. Free the capital. Re-deploy on the next signal.
Gamma Risk Explodes Near Expiry
Inside the last 7 days of an option's life, the price moves more violently per dollar of stock movement. A spread that's been quietly winning for 30 days can flip from +60% to −90% in a single afternoon if the stock makes one move through your short strike. The last week of an option's life is the most dangerous. Close before you get there.
Risk-Adjusted Return Math
The longer you hold for the last scraps of premium, the worse the trade-off gets — you risk a large share of your max loss to squeeze out a shrinking remainder of max profit. The early part of the move is the cheap, easy part; the tail end is where the risk-reward turns against you. Take the early skim. Start a new trade. Compound winners.
One Bad Pin Erases a Month
A single short strike that closes one cent in-the-money on Friday can wipe out four winning trades. Assignment risk on the short leg around dividends, news, or a Friday close near your strike turns a "winning" position into a forced shares position. Close it. Don't get pinned.
The Profit-Take Matrix — Every Structure
Place these closing orders the moment you fill the opening trade. The credit targets below are the Hou5eMoney house default — adjust them to your own comfort. "Set it, walk away, let it work."
| Structure | House Close Target | Why |
|---|---|---|
| Bull Put Spread (credit) | Buy to close at ~75% of the credit (bank 25%) | You captured the easy part of the move. Don't risk gamma chasing the rest. |
| Bear Call Spread (credit) | Buy to close at ~75% of the credit (bank 25%) | Same math, mirrored direction. Skim and reset. |
| Iron Condor (credit) | Buy to close at ~75% of the credit (bank 25%) | Two short strikes = double the gamma exposure. Take the bite and move on. |
| Cash-Secured Put (CSP) | Buy to close at ~75% of the credit (bank 25%) | Frees cash to sell another CSP. The Wheel only spins if you keep moving. |
| Covered Call | Buy to close at ~75% of the credit (bank 25%) | Lets you roll up if the stock keeps rallying. Don't get called away cheap. |
| Bull Call Spread (debit) | Your call — take profit when you're satisfied | Debit plays are directional. Set a target you're happy with and use the Exit Dot to get out — we don't promise a fixed return. |
| Bear Put Spread (debit) | Your call — take profit when you're satisfied | Same idea, mirrored. Plan your exit before you enter. |
| Long Call (naked long) | Your call — take profit, don't get greedy | Theta grinds against you every day. Set a target, take the money, re-enter on the next arrow. |
| Long Put (naked long) | Your call — take profit, don't get greedy | Long puts decay even faster as IV crushes after the move. |
How to Place a Closing Order in ThinkorSwim
Do this immediately after every opening fill. It takes 30 seconds. It is the single highest-EV habit in options trading.
Step-by-Step — GTC Closing Order
- Right-click your filled position in the Monitor → Position Statement tab.
- Select "Create Closing Order". The ticket will populate with the exact opposite of your opening trade (buy to close if you sold, sell to close if you bought).
- Set your price to your close target. For a credit spread you sold for $1.00, set the buy-to-close around $0.75 (keeping ~25% of the credit). For a debit trade, set your sell-to-close at whatever gain you've decided you're happy taking.
- Change Duration to "GTC" (Good 'Til Cancelled). The order stays alive across sessions until it fills or you cancel it.
- Send the order. Walk away. The Tradedesk will tell you if the trend changes before your target hits — and that is the only reason you'd cancel early.
When to Close Before Hitting Your Profit Target
Taking up to 25% of the credit is the house default. But the Tradedesk overrides any target on three signals — close early no matter where you are.
Trend Flip Against You
Purple Exit Dot, GRID: EXIT, or Trigger arrow reversal against your position = close immediately, even at 20% profit or a small loss. The read is gone. Take what's left.
Big Move Through Your Short Strike
If the stock blows through the short leg of a credit spread, do not wait for "max loss" to fill. Close it — or roll it — when the spread is at 2x the credit received. Hogs get slaughtered.
21 DTE — The Tom Sosnoff Rule
If a credit spread or CSP hasn't reached your close target by 21 days to expiry, close it or roll it. Don't ride into the gamma zone hoping for a comeback. Gamma kills theta sellers in the last three weeks.
Your Trading Platform — Why ThinkorSwim
Every options trade in this system is placed through ThinkorSwim (TOS) by Schwab — the most powerful retail options platform available, and the one the entire Hou5eMoney Tradedesk was built and tested on. Before you look at a single order ticket, you need to know why we use it and what it gives you that other platforms do not.
Why ThinkorSwim for Options
Included with a Schwab Account
TOS comes with any Schwab brokerage account — no subscription, no data fees for standard quotes. Open a Schwab brokerage account and download TOS. Paper Money (simulated trading) is included at no cost. You can practice for months before risking a dollar.
Built for Options
The entire interface is designed around options — the chain, the order ticket, the P&L graph, the risk analysis tab. Every feature the Tradedesk needs is native: multi-leg spread entry, Greeks display, IVR, probability cone, and real-time streaming data.
Paper Money = Zero-Risk Learning
TOS Paper Money mode gives you a simulated $100,000 account with real-time fills. You practice placing spreads, reading the chain, and managing positions — with real market data, zero real money. This is non-negotiable before going live.
The Four Parts of TOS You Actually Use
| TOS Section | What It Does | When You Use It |
|---|---|---|
| Trade Tab → Options Chain | Shows every available strike and expiry for a ticker. Bid, ask, delta, OI for every option. | Every time you pick a strike to sell or buy. This is your entry point for every trade. |
| Order Confirmation Dialog | The final popup before your order goes live. Shows order description, cost, BP effect, warnings, and legs. | Every single trade. Read every row before you click Send. Never skip this screen. |
| Monitor Tab → Positions | Shows all your open positions, current P&L, and days to expiry. | Daily. Check your spreads every morning — know where you stand before the market opens. |
| Analyze Tab → Risk Profile | Graphs your spread's P&L curve at expiry. Shows breakeven visually. | When learning a new structure or sizing up a larger position. Visualizes exactly where you win and lose. |
The Two Things TOS Cannot Do For You
Read the Market Direction
TOS is an execution platform — it fills orders. It does not tell you which way the market is going or when to enter. That is what the Hou5eMoney Tradedesk does. The five indicators give you direction, timing, and structure selection. TOS executes the decision after you make it.
Protect You From Yourself
TOS will let you place a naked short if you have margin enabled. It will let you sell 10 contracts when you meant 1. It will let you enter the wrong expiry. Paper trading for 30+ days builds the muscle memory and checklist habits that prevent these errors. The platform is powerful — that cuts both ways.
Reading ThinkorSwim — The Options Chain
Every options trade starts here. When you type a ticker and click the Trade tab in ThinkorSwim, you see the options chain — a grid of every available strike and expiry. This page decodes every column so nothing surprises you when it counts.
30 DTE = 30 days left → sweet spot for premium selling
Obligation: buy 100 shares at $157 if it falls there
Mid = (2.70 + 2.90) ÷ 2 = $2.80 — use this
Delta −.50 (ATM) ≈ 50% chance — avoid for selling
OI below 200 → skip this strike, find another
TOS pairs it with the $147 Put automatically
Reading ThinkorSwim — The Order Ticket
After you right-click a strike and select Sell → Vertical, ThinkorSwim opens the Order Confirmation Dialog. This is your last checkpoint before anything is real. Read every row. If anything looks wrong — wrong ticker, wrong strike, only one leg — hit Delete and start over. Here is what every line means.
SELL = you are collecting premium. −1 = one contract (100 shares). VERTICAL = spread — two legs. 157/147 = short strike $157 / long strike $147. 2.80 LMT = $2.80 per share credit = $280 per contract. [TO OPEN] = brand new position.
The Four Numbers Every Beginner Must Know
Before you place any options trade you must be able to answer these four questions. Pull them from the order ticket every time.
Time is working for you every day (theta decay). You do not need to do anything to earn it — just hold and let the clock run.
After fees: $219.60 net = your real max profit
Formula: (short strike − long strike − credit received) × 100
Note: borrow costs (on ETFs like SOXL) and early-assignment/dividend risk are additional charges not captured in this number — see the warning rows on your ticket.
Only happens if SOXL crashes below $147 by expiry
Bull put spread formula: short strike − net credit = breakeven
The buffer is the distance from current price to your breakeven. The larger the buffer, the more the stock can fall before you lose a dollar. Always know this number before you enter.
SOXL at $173.20 → needs to fall $19 before you lose
If you only see one leg in the legs table, you do not have a spread — you have a naked short put with uncapped risk. Delete the order immediately and re-enter correctly.
✅ BUY +1 VERTICAL 147 PUT (your hard stop)
❌ Only one leg showing = naked short = DELETE NOW
① Order description line matches your intended trade exactly · ② Both legs visible in the legs table · ③ Buying Power Effect is negative (as expected) and you have enough BP · ④ No red warning you cannot explain · ⑤ You know your max profit, max loss, and breakeven before you click Send
The Wheel Strategy
The Wheel is the most mechanical, Tradedesk-friendly options strategy that exists. It is a three-stage cycle that generates premium income from stocks you are already bullish on — using the same trend signals you already read every day. The Tradedesk was built for this.
Reading the Tradedesk for the Wheel
| Tradedesk Signal | Wheel Action | Notes |
|---|---|---|
| TREND BULL all 5 | Sell the CSP — full size | Strongest environment. Theta working, trend backing the position. |
| CONFLUENCE BUY | Sell CSP immediately on bar close | Highest-conviction long signal. Best entry for a new CSP cycle. |
| BUY DIP + IVR > 50% | Sell CSP at the dip low | Price pulled back to fast EMA. Premium elevated. Ideal wheel entry. |
| GRID: HOLDING BULL | Hold existing CSP / covered call | Trend intact. Let theta decay work. No adjustments needed. |
| CHOP on any indicator | No new CSPs. Manage existing only | Chop means price can break either way. Never start a wheel in chop. |
| TREND BEAR / BREAKDOWN | Close or roll CSP immediately | Trend flipped. The stock is moving against your put obligation. Act fast. |
| EXIT LONG dot (purple) | Close covered call early / roll out | Momentum rolling over. Consider closing covered call for a profit or rolling to a higher strike. |
Wheel Strike Selection Using IVR + EXP
IVR > 50% — Ideal Wheel Environment
Premium is elevated. Every CSP and covered call you sell is collecting above-average income. Size up within your defined risk. The Pulse pill shows green when IVR is rising — that's the accelerant on your theta collection.
IVR < 30% — Thin Premium Warning
Premium is cheap. CSP income is below average. Either wait for IVR to rise, move closer to ATM (more risk), or skip the wheel and use a debit spread instead. Low IVR + BULL trend = debit call spread, not a wheel.
The Wheel — Chart Read + Order Setup
Here is what a wheel candidate looks like inside ThinkorSwim with the Tradedesk running. You are looking at Ford (F) — a low-priced stock with liquid options, a clear daily bull trend, and IVR near 50%. The 4H is still in chop, but the daily structure gives you the direction. You are waiting for the 4H to confirm before opening the CSP.
📊 What You're Seeing — Ford Multi-Timeframe Read
4H (left): TREND CHOP · GRID: WAIT — the fast EMA (cyan) and slow EMA (yellow) are tangled. Gray candles confirm chop. No Trigger arrow has fired. The 4H is your entry timing clock and it is saying not yet. Notice the candles are gray — that is the Tradedesk chop color.
1D (center): TREND BULL · GRID: HOLDING BULL · STRENGTH 77 — green candles with BUY DIP arrows visible. The daily is in a healthy bull trend with buyers dominating. This tells you which side of the trade you want: bull side only.
1W (right): TREND BULL · STRENGTH 25 — weakening on the weekly but still positive. IVR 42% — approaching the 50% zone. As IVR climbs toward and above 50%, the CSP income improves.
When the Signal Fires — How to Set Up the CSP in TOS
📋 What This Order Actually Means — CSP on Ford
⚠️ What Those Red Warnings on the Ticket Actually Mean
The Wheel — Stage 3: Selling a Covered Call
Tradedesk setup: Assigned on the CSP at $112 · Now own 100 shares · GRID: HOLDING BULL · TREND BULL · IVR > 45% · Sell call above your cost basis
📋 What This Order Actually Means — Covered Call on Ford
⚠️ What Those Red Warnings on the Ticket Actually Mean
Credit Spreads
A credit spread is a wheel-style premium collection trade with defined maximum loss. You sell one option and buy a cheaper one further OTM to cap your risk. You collect a net credit. You keep that credit if the stock stays on the right side of your short strike at expiry. This is the primary trade structure of the Tradedesk options system.
Bull Put Spread (Credit)
Sell an OTM put. Buy a further OTM put as protection. Net credit collected. Profits if price stays above the short put strike. Used when: TREND BULL, IVR > 50%, BUY DIP or CONFLUENCE BUY signal fires.
Bear Call Spread (Credit)
Sell an OTM call. Buy a further OTM call as protection. Net credit collected. Profits if price stays below the short call strike. Used when: TREND BEAR, IVR > 50%, SELL RIP or CONFLUENCE SELL signal fires.
Anatomy of a Bull Put Spread
Reading the Tradedesk for Credit Spreads
| Indicator Read | Credit Spread Action |
|---|---|
| TREND BULL + IVR > 50% | Sell bull put spread. Full confirmation. Size at your standard unit. |
| CONFLUENCE BUY | Sell bull put spread immediately. Highest conviction entry. FLOW + HM5 aligned. Use this bar's close as your reference. |
| BUY DIP + FLOW TREND BULL | Sell bull put spread at the dip. Put your short strike below the dip low. Let the bounce work for you. |
| GRID: HOLDING BULL | Hold existing bull put spread. Theta is working. No adjustment needed unless trend changes. |
| TREND BEAR + IVR > 50% | Sell bear call spread. Mirror setup. Short strike above the rip high. |
| CONFLUENCE SELL | Sell bear call spread immediately. Strongest short signal. FLOW bear + HM5 aligned. |
| CHOP on any dashboard | No new spreads. Manage existing. Chop eats credit spreads alive — you get tested from both sides. |
| EXIT LONG dot fires against spread | Close the spread early. Take whatever you've got — up to your 25% target. Don't give it back. The Exit Dot is real. |
Strike Selection — The 1× EXP Rule
Your short strike must be at least 1× EXP away from current price. The EXP pill on Pulse gives you the market's own estimate of the expected move. Selling inside EXP = selling in the expected zone = lower probability. Selling outside EXP = selling beyond the expected move = higher probability of expiring worthless.
Bull Put Spread — Chart Read + Order Setup
Here is what an A+ credit spread setup looks like. SOXL shows all five indicators aligned bullish, IVR at 91% (historically expensive premium), and Tide showing an TREND BULL SURGE. This is the highest-conviction environment for selling a bull put spread.
✅ What You're Seeing — SOXL Full Bull Alignment
4H: TREND BULL · GRID: HOLDING BULL · STRENGTH 74 · ACCEL + — green candles above all three EMAs. The fast cyan EMA is rising above the slow yellow EMA, both above the gray big EMA. BUY DIP and BREAKOUT arrows visible on chart.
1D: STRENGTH 83 · IVR 91% · BUY 96% / SELL 4% — the daily chart is in full bull stride. IVR at 91% is the key — premium is near its 52-week highs. Every bull put spread you sell here collects above-average income.
1W: TREND BULL SURGE (272% of 30-week average) — institutional volume is more than double normal. Weekly trend firmly bull. This is the fuel driving the move. STRENGTH 102 is above the +100 maximum — extreme conviction.
How to Set Up the Bull Put Spread in TOS
📋 What This Order Actually Means — Bull Put Spread on SOXL
⚠️ What Those Red Warnings on the Ticket Actually Mean
Debit Spreads
When IVR is low, buying options outright is cheap — but you pay theta every day. A debit spread solves this. You buy an ATM or slightly OTM option for direction, and sell a further OTM option to offset the cost and reduce theta drag. You pay a net debit. You profit when price moves to your long strike. Maximum loss is the premium paid. Maximum gain is the spread width minus the debit.
Bull Call Spread (Debit)
Buy an ATM or slightly OTM call. Sell a further OTM call to reduce cost. Net debit paid. Profits when price rises above the long strike. Used when: TREND BULL, IVR < 50%, BREAKOUT or CONFLUENCE BUY fires with strong momentum.
Bear Put Spread (Debit)
Buy an ATM or slightly OTM put. Sell a further OTM put to reduce cost. Net debit paid. Profits when price falls below the long strike. Used when: TREND BEAR, IVR < 50%, BREAKDOWN or CONFLUENCE SELL fires with strong momentum.
Anatomy of a Bull Call Spread
Reading the Tradedesk for Debit Spreads
| Signal Combo | Debit Spread Action | Notes |
|---|---|---|
| BREAKOUT + IVR < 50% | Buy bull call spread | Price breaking range on volume. Low IV = cheap debit. Strong momentum = fast move to target. |
| CONFLUENCE BUY + Pulse STRENGTH > +60 | Buy bull call spread — size up | Highest conviction. FLOW + HM5 + strong Pulse = the stack is all-in. This is an A+ debit entry. |
| BUY DIP + ACCEL UP on FLOW | Buy bull call spread at the dip reclaim | Dip absorbed with acceleration. Debit spread captures the bounce with defined risk. |
| SQZ FIRED in bull regime | Buy bull call spread immediately | Squeeze release = volatility expansion. Buy before IV rises further. Take the break direction. |
| BREAKDOWN + IVR < 50% | Buy bear put spread | Mirror of the breakout setup. Price breaking down on volume. FLOW bias must agree — BEAR. |
| CONFLUENCE SELL | Buy bear put spread — size up | Strongest short signal. Same A+ logic applies on the short side. |
Debit vs. Credit — The IVR Decision Tree
Every morning, before picking any structure, look at the IVR pill on Pulse. This single number makes the decision for you:
| IVR Reading | Premium Environment | Preferred Structure | Tradedesk Signals That Pair |
|---|---|---|---|
| > 50% | Expensive — sell it | Credit spreads, CSPs, Covered Calls, Wheel | Any trend signal + TIDE TREND BULL with VOL ≥100% |
| 30–50% | Neutral — either works | Credit spreads slightly favored. Debit if BREAKOUT imminent. | SQZ FIRED = lean debit. HOLDING BULL = lean credit. |
| < 30% | Cheap — buy it | Debit spreads, long calls/puts with spread overlay | BREAKOUT, CONFLUENCE BUY/SELL, SQZ FIRED |
Bull Call Spread — ThinkorSwim Setup
Tradedesk setup: TREND BULL · IVR 34% (cheap premium → buy it) · SQZ FIRED in bull regime · BREAKOUT arrow · FLOW: ACCEL UP (yellow bars) · PULSE STRENGTH > +60
📋 What This Order Actually Means — Bull Call Spread on AAPL
⚠️ What Those Red Warnings on the Ticket Actually Mean
Bear Call Spread — Chart Read + Order Setup
Here is the mirror of the bull put spread. QQQ is in a full bear regime across all timeframes — magenta candles, EMA stack inverted, FLOW bear, Tide showing TREND BEAR (VOL ≥100%). IVR at 68% means premium is elevated and worth selling. This is the environment for a bear call spread.
🔴 What You're Seeing — QQQ Full Bear Alignment
4H: TREND BEAR · SELL RIP signal · STRENGTH −62 · ACCEL DN · TREND BEAR — magenta candles below all EMAs. SELL RIP arrows and BREAKDOWN arrows visible. The fast EMA (cyan) is below the slow EMA (yellow).
1D: TREND BEAR · STRENGTH −71 · IVR 68% · BUY 18% / SELL 82% — strong bear conviction on the daily. Only 18% of volume is buying. 82% is selling. The flow confirms the trend.
1W: TREND BEAR SURGE (184% of 30-week average) — institutional selling is running well above average. STRENGTH −55 on the weekly confirms this is not a short-term dip, it is a macro trend change.
How to Set Up the Bear Call Spread in TOS
📋 What This Order Actually Means — Bear Call Spread on QQQ
⚠️ What Those Red Warnings on the Ticket Actually Mean
Expected Move — How Far Is "Normal"?
Every stock has a normal-sized move for a given stretch of time. Some days it drifts, some days it lurches. Expected Move (EXP) is the market's own number for that — how far the stock is likely to travel, up or down, over a window. The best part: you don't calculate it. Your dashboard already shows it.
It lives on the Pulse pane as the EXP $8.96 pill. That cyan number is the whole tool. Once you know how to use it, you'll never guess where to put a strike again.
↑ The Pulse dashboard. The cyan EXP pill is your distance number.
What EXP Tells You
How big a normal move is, in dollars. "About this far is expected." It is built from price and IV — the options market's live volatility read.
What EXP Does NOT Tell You
Direction. EXP is the size of the swing, not which way. Your Tradedesk stack (TREND, FLOW, TIDE) gives you direction. EXP gives you distance.
The 2-Out-Of-3 Band
Take today's price and add EXP for the ceiling, subtract it for the floor. The stock finishes inside that band about two-thirds of the time — roughly 2 weeks out of 3. Going outside it is the rarer 1-in-3 event. That band is the heart of every spread you place.
The Multiplier — Stretch EXP For Your Hold
EXP is one day. But you don't hold a credit spread for one day — you hold it for a week, two weeks, a month. The longer you hold, the more room the stock has to wander. So you multiply EXP by a number based on how many days you're in the trade.
Here's the only thing that surprises people: a 25-day move is not 25× a one-day move. It's only about 5×. Moves don't pile up in a straight line — markets spread out slower than time passes. The multiplier is just the square root of the days (√). You never have to do that math, though. Use the table.
The Cheat Sheet — DTE to Multiplier
| Days Held (DTE) | × Multiplier | Typical Trade |
|---|---|---|
| 1 | 1.0 | 0DTE / same-day play |
| 3 | 1.7 | Weeklies (Mon → Friday) |
| 5 | 2.2 | — |
| 7 | 2.6 | One week out |
| 10 | 3.2 | — |
| 14 | 3.7 | Two weeks out |
| 21 | 4.6 | Credit spread range (start) |
| 30 | 5.5 | Credit spread sweet spot |
| 36 | 6.0 | — |
| 45 | 6.7 | Credit spread range (end) |
Setting Your Strike — Put It Past The Line
Now you put the two pieces together. EXP from page one, the multiplier from page two, and three simple steps. This is the same idea as the 1× EXP Rule in the Credit Spreads tab — just done properly for however long you actually hold.
Call spread: sell above the line. • Put spread: flip the sign (price − EXP×mult) and sell below.
Worked Example — ADBE at 237.88, EXP $8.96
| Hold | The Math | Your Line | Sell Call Above |
|---|---|---|---|
| 3 days | 237.88 + (8.96 × 1.7) | ~253 | 253 |
| 10 days | 237.88 + (8.96 × 3.2) | ~267 | 267 |
| 25 days | 237.88 + (8.96 × 5.0) | ~283 | 283 |
| 45 days | 237.88 + (8.96 × 6.7) | ~298 | 298 |
Notice the line walks further out the longer you hold — same stock, same EXP, just more time for it to move. A 3-day spread sells at 253; a 45-day spread can sell all the way out at 298 and still be "outside normal."
Find the line. Sell past it.
That's expected move in one sentence.
The line is a guide, not a wall — price can still cross it. That's why you size small and respect your stops.
HM5 Scanners — Options Edition
The scanners are your hunters. They surface candidates for spreads and wheel trades before you open a chart. A scanner result means: look here. The indicators confirm: act here. Never confuse those two things.
Macro direction · Institutional flow · Stable trend environments · Premium selling
Credit spreads · Wheel candidates · Covered call writing · CSP income plays
Best Used: Premarket · Late day · Mondays · Thursdays
Personality: The calm veteran options seller. Not chasing. Not guessing. Positioning for premium with structure behind it.
Establish directional bias · Locate continuation structure · Build your wheel watchlist
Wheel candidate screening · Bull put spread candidates · Covered call underlying selection
Best Used: Premarket · Midday · Power hour
Personality: Your map. It tells you where the road actually goes — before you bet your premium on it.
Primary setup engine · Momentum continuation · High beta expansion
Debit spreads · Aggressive continuation calls/puts · Short-dated momentum plays
Best Used: 8:00 AM – 10:00 AM MT · Tuesdays · Thursdays
Personality: This scanner drinks espresso and breaks resistance levels. It finds the debit spread setups.
Detect exhaustion · Spot reversals · Locate hidden accumulation/distribution
Bear call spread candidates · Reclaim buy spread setups · Trap reversal entries
Best Used: Wednesdays · Midday · After major runs
Personality: This scanner sees lies. If price is ripping but flow is bleeding, this finds it first.
Detect squeeze releases · Volatility expansion · Early acceleration
Debit spreads before IV rise · Long straddle territory · Momentum debit plays
Best Used: 7:30 AM – 10:00 AM MT · Tuesdays · Thursdays · After consolidations
Personality: A coiled spring. The debit spread buyer's best friend. Buy the spread before SQZ FIRES — not after.
Opening momentum discovery · Institutional drive detection · Fast continuation
0DTE or short-dated debit spreads · Fast directional calls/puts · Open momentum plays
Best Used: 7:30 AM – 8:30 AM MT · Tuesdays · Fridays
Personality: Kicks the market door open. You are NOT holding these options overnight. These are fast, defined-risk, in-and-out plays.
Reading the Tradedesk Together
The whole point of running five indicators is confluence. A real spread trade is one where all five agree at the same bar. Walk down your screen before every entry:
- Trigger — Direction. Arrow fired? Which signal type? Is speed/mode correct for your timeframe?
- Pulse — Structure. IVR above or below 50%? STRENGTH past ±50? SQZ state?
- Flow — Truth. BIAS on your side? No opposite divergence dot in the last 2 bars?
- Grid — Structure. GRID BUY or HOLDING BULL? Not WAIT or EXIT?
- Tide — Size. WK% above 100%? a green or yellow VOL pill on your side?
If all five answers are yes, take it. If two or more are no, you don't have a spread — you have a hope trade.
The A+ Options Setups
A+ #1 — The Triple-Confirm Breakout Spread
The yellow BREAKOUT arrow is "triple-confirmed" by TRIGGER itself — it only fires when price closes above the prior range high, volume is above average, AND ATR is expanding. On top of that the stack agrees: Pulse STRENGTH above +60 with a yellow breakout dot, Flow prints a yellow ACCEL UP bar, Grid prints GRID: BUY, and Tide is TREND BULL or TREND BULL SURGE.
Sell a bull put spread below the breakout candle's low. Width = 1× EXP or ATR. Collect credit. Target: full premium decay. Exit trigger: EXIT LONG dot or trend reversal.
Buy a bull call spread. Long strike at or slightly above the breakout close. Short strike 1× EXP above that. Take profit when you're satisfied or on the Exit Dot — your call. Do not hold debit spreads to expiry.
A+ #2 — The Dip Buy Spread (CVD Absorption)
Trend is BULL on all dashboards. Price pulls back to the fast EMA. Trigger fires a lime BUY DIP arrow. Flow shows a cyan divergence dot and BIAS flips back to BULL. Pulse STRENGTH curling up off the zero line.
Sell a bull put spread — short strike below the dip low, width = 1× EXP. This is the ideal wheel CSP entry too: cash-secured put at or below the dip low.
Buy a bull call spread — long strike at or just above the dip reclaim close. The divergence dot confirms buyers absorbed the dip. Catch the bounce with defined risk.
A+ #3 — Confluence Buy/Sell Spread (Highest Priority)
Trigger fires a cyan CONFLUENCE BUY or deep-orange CONFLUENCE SELL arrow. FLOW CVD and the HM5 Exit Dot are both aligned simultaneously. This is the desk's single strongest signal. Grid is HOLDING BULL. Pulse STRENGTH is rising.
Regardless of IVR — this signal justifies either structure. IVR > 50%: sell a credit spread, size up. IVR < 50%: buy a debit spread, size up. Do not hesitate on this signal — it is the most filtered entry in the entire stack. Stop below the bar's low (for bull) or above bar's high (for bear).
A+ #4 — Trap Reversal Spread
A breakout fires against the macro trend, then immediately fails. Pulse drops a cyan (Trap Long) or red (Trap Short) dot. Flow shows opposite-color absorption. The next candle closes back through the midpoint of the trap bar.
Enter a credit spread in the reversal direction. If Trap Short (red): sell bear call spread above the failed breakout high. If Trap Long (cyan): sell bull put spread below the failed breakdown low. These move fast — take 50% profit quickly, trail the rest. Max loss is the spread width.
Complete Daily Schedule — Options Edition
The market opens at 7:30 AM MT (9:30 AM ET) and closes at 2:00 PM MT (4:00 PM ET). Not all hours are equal for options traders. This schedule tells you exactly what structure to run, when to enter premium, and when to keep your hands in your pockets.
Scanners: HM WEEKLY CREDIT · HM DAILY TREND | Indicators: TIDE · GRID · PULSE (check IVR)
- Check IVR across your watchlist — decide credit vs. debit bias for the day before the open.
- Check TIDE — heavy-flow week means larger spread size. Thin tape = half size all day.
- Use HM DAILY TREND to confirm structure. Choppy = stand aside that name, no wheel entries.
- Mark EXP for your top 3–5 names. Know your strike levels BEFORE the open.
- Set your max loss for the day BEFORE you see the first candle.
Scanners: HM 4H HIGH BETA · HM SQUEEZE EXPANSION 1H | Indicators: TRIGGER (mode/speed set) · PULSE (check SQZ)
- Confirm your top 3–5 names. Drop the rest. Spread traders need focus, not quantity.
- Look for SQZ ON in PULSE. Squeeze candidates are your A+ debit spread plays at the open.
- Identify your exact strike prices using EXP pill — already done from premarket.
- Decide: which names are credit plays (IVR > 50%) and which are debit plays (IVR < 50%).
Scanners: HM OPEN DRIVE 5M | Indicators: TRIGGER · FLOW · PULSE
- Wait for BREAKOUT, RECLAIM BUY, or CONFLUENCE BUY before any debit spread entry at the open.
- FLOW must confirm — TREND BULL + ACCEL UP for call spreads. TREND BEAR + ACCEL DN for put spreads.
- PULSE STRENGTH past ±40 minimum. Gray bars = no spread entry.
- These are fast plays. Short DTE (0–7 days). Have your exit price before you enter. Do not hold through lunch.
Scanners: HM 4H HIGH BETA · HM SQUEEZE EXPANSION 1H | Indicators: TRIGGER · FLOW · PULSE · GRID · TIDE
- WEEKLY (TIDE) aligned + DAILY (GRID) aligned + 4H FLOW accelerating = A+ spread conditions.
- GRID must show HOLDING BULL (or BEAR). GRID: WAIT = no new spread entries.
- PULSE STRENGTH above +50 for bull spreads, below –50 for bear spreads.
- TRIGGER must fire CONFLUENCE BUY, BREAKOUT, or RECLAIM BUY for bull credit/debit entries.
- Credit spreads with 21–30 DTE are prime here. Debit spreads 7–14 DTE. Time is money.
Scanners: HM FLOW DIVERGENCE 4H | Indicators: FLOW (watch for divergence) · GRID
- Manage open winners — take up to 25% of the credit on credit spreads if available. Never give back a winner.
- Use HM FLOW DIVERGENCE 4H to spot exhaustion in existing credit spread positions.
- If GRID flips to WAIT, evaluate all open bull spreads and CSPs for early close or roll.
- Bear divergence dot (red) in midday on a bull spread position = consider closing early.
Scanners: HM DAILY TREND · HM WEEKLY CREDIT | Indicators: TIDE · FLOW
- Watch TIDE — if weekly volume is surging into close, institutional repositioning is real. Credit spread opportunities are highest conviction here.
- FLOW BIAS shift late in the day can signal an overnight trend change — adjust open wheel positions accordingly.
- Best for new credit spread entries with 21–45 DTE — collect premium into a confirmed close-of-day trend.
- Close all 0DTE and short-dated day-trade spreads by 1:50 PM MT. Do not hold 0DTE into the final 10 minutes.
Day-by-Day Personality
| Day | Vibe | Options Approach | Best Scanners |
|---|---|---|---|
| MONDAY | The market is waking up. Fresh rotations, new leaders, macro direction establishing. | Credit spreads and new CSP entries on names with confirmed DAILY trend. Lighter size. Wait for the trend to establish. | HM WEEKLY CREDIT · HM DAILY TREND |
| TUESDAY | Momentum day. Continuation from Monday's rotations. Squeeze setups fire. Aggression: HIGH. | Debit spreads on SQZ FIRED names. Bull call spreads on BREAKOUT signals. Prime day for short-dated directional plays. | HM OPEN DRIVE 5M · HM 4H HIGH BETA · HM SQUEEZE EXPANSION 1H |
| WEDNESDAY | Reset day. The market traps traders. Reclaims, reversals, failed breakouts. | Look for Trap Reversal spreads. Bear call spreads on exhausted runs. FLOW DIVERGENCE is your primary entry filter today. | HM FLOW DIVERGENCE 4H · HM SQUEEZE EXPANSION 1H |
| THURSDAY | Continuation day. Strong names keep running. Weak names accelerate down. Aggression: HIGH. | Roll profitable CSPs up and out. Add new credit spreads on trending names. Best day for 7–14 DTE debit spreads on momentum continuations. | HM 4H HIGH BETA · HM DAILY TREND · HM SQUEEZE EXPANSION 1H |
| FRIDAY | Protect your week. Aggressive in morning. Very careful in afternoon. No new overnight risk. | Morning: fast debit spreads if BREAKOUT fires cleanly. Afternoon: close all short-dated spreads. Do NOT carry speculative positions into the weekend. Collect any remaining theta on credit spreads Monday. | HM OPEN DRIVE 5M · HM DAILY TREND |
When to Use Each Structure
| Use CREDIT SPREADS When: | Use DEBIT SPREADS When: | Use THE WHEEL When: |
|---|---|---|
Scanners: HM WEEKLY CREDIT · HM DAILY TREND Avoid during: squeeze fires, earnings, violent expansion days |
Scanners: HM 4H HIGH BETA · HM SQUEEZE EXPANSION 1H · HM OPEN DRIVE 5M |
Scanners: HM WEEKLY CREDIT · HM DAILY TREND Never wheel a stock you wouldn't hold for months if assigned |
Skip This Spread Unless...
If you can't check off at least four of these boxes, the spread isn't A+ — pass. The premium will still be there tomorrow.
Audio Alerts Mapped to Options Actions
Every indicator fires audio alerts on bar close. Here is what each alert means for your options workflow. Right-click any indicator, scroll to Alerts, and toggle on what you want.
| Indicator | Alert | Options Action |
|---|---|---|
| TRIGGER | CONFLUENCE BUY | Sell bull put spread or buy bull call spread immediately. Highest conviction. |
| TRIGGER | CONFLUENCE SELL | Sell bear call spread or buy bear put spread immediately. |
| TRIGGER | BREAKOUT — BUY | Sell bull put spread below breakout low. Or buy bull call spread at close. |
| TRIGGER | BREAKDOWN — SELL | Sell bear call spread above breakdown high. Or buy bear put spread at close. |
| TRIGGER | BUY THE DIP | New CSP or bull put spread. Short strike below dip low. Wheel entry. |
| TRIGGER | EXIT LONG — CLOSE | Close or roll bull spreads. Take covered call profit. Evaluate CSP assignment risk. |
| TRIGGER | TRAP SHORT / LONG | Reversal spread in the trap direction. Fast, defined-risk entry. |
| PULSE | SQZ FIRED — BUY | Buy bull call spread NOW. IV about to expand — get in before the premium rises. |
| PULSE | SQZ FIRED — SELL | Buy bear put spread NOW. Squeeze breaking to the downside. |
| FLOW | BULLISH DIVERGENCE | Cyan dot at bottom. Close bear spreads. Consider bull put spread or new CSP. |
| FLOW | BEARISH DIVERGENCE | Red dot at top. Close bull spreads early. Consider bear call spread. |
| FLOW | BULL ACCELERATION | Yellow bar fired. Confirm existing bull spread. New debit call spread if IVR permits. |
| GRID | GRID — BUY SIGNAL | New CSP or bull put spread entry. EMAs stacked bull. Full confirmation. |
| GRID | GRID — MOMENTUM DOWN | Close or roll all bull spreads and CSPs. Fast EMA broke down. |
| TIDE | TREND BULL SURGE | Size up existing bull spread positions. Institutional money confirming the move. |
| TIDE | TREND BEAR SURGE | Evaluate all bull spreads for early close. Bear spreads get full size. |
Beginner Rules — Options Edition
Final Thought
The HOU5EMONEY Tradedesk is NOT about trading constantly.
It is about trading intelligently.
You are not trying to predict every move.
You are trying to find the BEST premium opportunities.
That's the difference between a professional options trader and someone paying tuition to the market.
Glossary Snapshot
Every abbreviation that appears on any Hou5eMoney dashboard or options trade, in one place.
Learn the Language. Then Trade It.
For deeper market structure, technical analysis, and options strategy, ask about the Hou5eMoney Trading Library and our live trading channels where every setup in this playbook is called in real time.
Disclaimer
- No Investment Advice; Educational Use Only. This playbook, the Hou5eMoney indicators, scripts, charts, signals, and any related materials are provided for general educational and informational purposes only. Nothing constitutes investment, financial, legal, tax, or accounting advice. Consult a licensed professional before making any trading or investment decision.
- Risk of Loss; No Guarantee of Results. Options trading involves substantial risk, including the potential loss of all capital. Defined-risk spreads cap your maximum loss to the spread width — they do not eliminate the risk of losing 100% of capital committed. Past performance, hypothetical results, and any signals produced by these materials are not indicative of future results. Trade only with capital you can afford to lose entirely.
- Options-Specific Risk. Options are complex instruments that expire. A spread that expires worthless results in total loss of premium paid (debit) or maximum spread-width loss (credit). Early assignment, pin risk, and liquidity risk are real and can affect even defined-risk positions.
- No Warranties. The materials are provided "AS IS" without warranty of any kind, including warranties of merchantability, fitness for a particular purpose, accuracy, or uninterrupted operation.
- Limitation of Liability. In no event shall Hou5eMoney be liable for any direct, indirect, incidental, special, consequential, or punitive damages, including lost profits or loss of capital, arising from use of or inability to use these materials.
- Intellectual Property. All materials — including the Hou5eMoney name, logos, indicator code, color systems, and this playbook — are the exclusive property of Hou5eMoney and protected by copyright, trademark, and applicable laws. No portion may be reproduced, distributed, sublicensed, reverse-engineered, or used to train any AI or derivative model without prior written consent.
- Governing Law. These terms are governed by the laws of the State of Delaware, USA.
The market speaks in color. Learn the language.